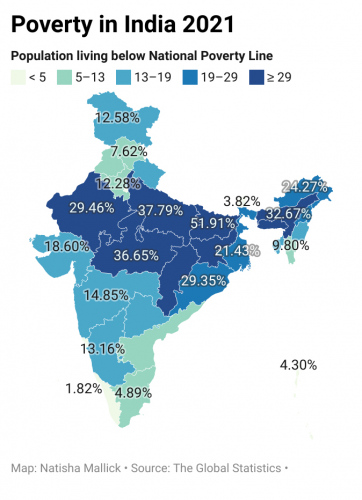
Population of Indians below National Poverty Line
Bihar, Jharkhand, Uttar Pradesh, Madhya Pradesh and Meghalaya are the poorest states in India.
51.91% of the population in Bihar is classified as poor, followed by Jharkhand with 42.16%, Uttar Pradesh with 37.79%, Madhya Pradesh with 36.65% and both Meghalaya & Assam with 32.67%.
Kerala has the lowest rate of poverty in India with only 0.71% of population classified as poor.
Followed by states like Goa with 3.76%, Sikkim with 3.82%, Tamil Nadu with 4.89% and Punjab woth 5.59%
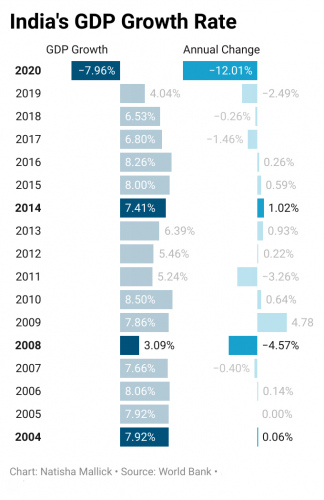
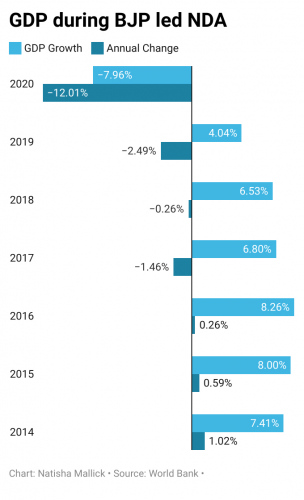
India’s GDP growth rate during the Modi 2.0 has seen an annual change of -12% in 2020 the largest decline with GDP at -7.96%.
During the UPA rule, the lowest the GDP growth rate went was at 3.09% in 2008 when global markets crashed.
Population of Indians below National Poverty Line
Bihar, Jharkhand, Uttar Pradesh, Madhya Pradesh and Meghalaya are the poorest states in India.
51.91% of the population in Bihar is classified as poor, followed by Jharkhand with 42.16%, Uttar Pradesh with 37.79%, Madhya Pradesh with 36.65% and both Meghalaya & Assam with 32.67%.
Kerala has the lowest rate of poverty in India with only 0.71% of population classified as poor.
Followed by states like Goa with 3.76%, Sikkim with 3.82%, Tamil Nadu with 4.89% and Punjab woth 5.59%
India’s GDP growth rate during the Modi 2.0 has seen an annual change of -12% in 2020 the largest decline with GDP at -7.96%.
During the UPA rule, the lowest the GDP growth rate went was at 3.09% in 2008 when global markets crashed.
- 1
-
2
Population of Indians below National Poverty Line
Bihar, Jharkhand, Uttar Pradesh, Madhya Pradesh and Meghalaya are the poorest states in India.
51.91% of the population in Bihar is classified as poor, followed by Jharkhand with 42.16%, Uttar Pradesh with 37.79%, Madhya Pradesh with 36.65% and both Meghalaya & Assam with 32.67%.
Kerala has the lowest rate of poverty in India with only 0.71% of population classified as poor.
Followed by states like Goa with 3.76%, Sikkim with 3.82%, Tamil Nadu with 4.89% and Punjab woth 5.59% -
3
India’s GDP growth rate during the Modi 2.0 has seen an annual change of -12% in 2020 the largest decline with GDP at -7.96%.
During the UPA rule, the lowest the GDP growth rate went was at 3.09% in 2008 when global markets crashed. - 4